Liquos / Water data & prototyping
Water Report Card: making water data understandable

Water Report Card explored how businesses and consumers could make sense of drinking-water information. I brought together sensor readings and municipal report data in prototypes designed to make complex measurements easier to interpret.
Result
Created prototypes that connected complex water-data sources with an understandable interface for business and consumer audiences.
- My scope
- As a consultant for Liquos, I led the Water Report Card project, developing prototypes with Figma, Next.js, and Mapbox to explain drinking-water data for businesses and consumers.
Exploring the WaterMap prototype
The original recording of the map-based Water Report Card prototype, preserved from the project archive.
Open demo videoMaking different data sources understandable
The project needed to translate data from IoT TDSBot sensors and municipal water reports into information that people could use. Those sources required a common presentation that made sense to both business and consumer audiences.
I focused on bringing the information together and expressing it through clear interfaces and data visualizations, rather than expecting people to interpret the raw readings themselves.
Exploring the experience through prototypes
I used Figma, Next.js, and Mapbox to develop the prototype experience. The work explored how location, water reports, and visual summaries could support a clearer understanding of drinking-water information.
The prototypes connected complex data with a more accessible experience for the people trying to understand it.
◇Artifacts
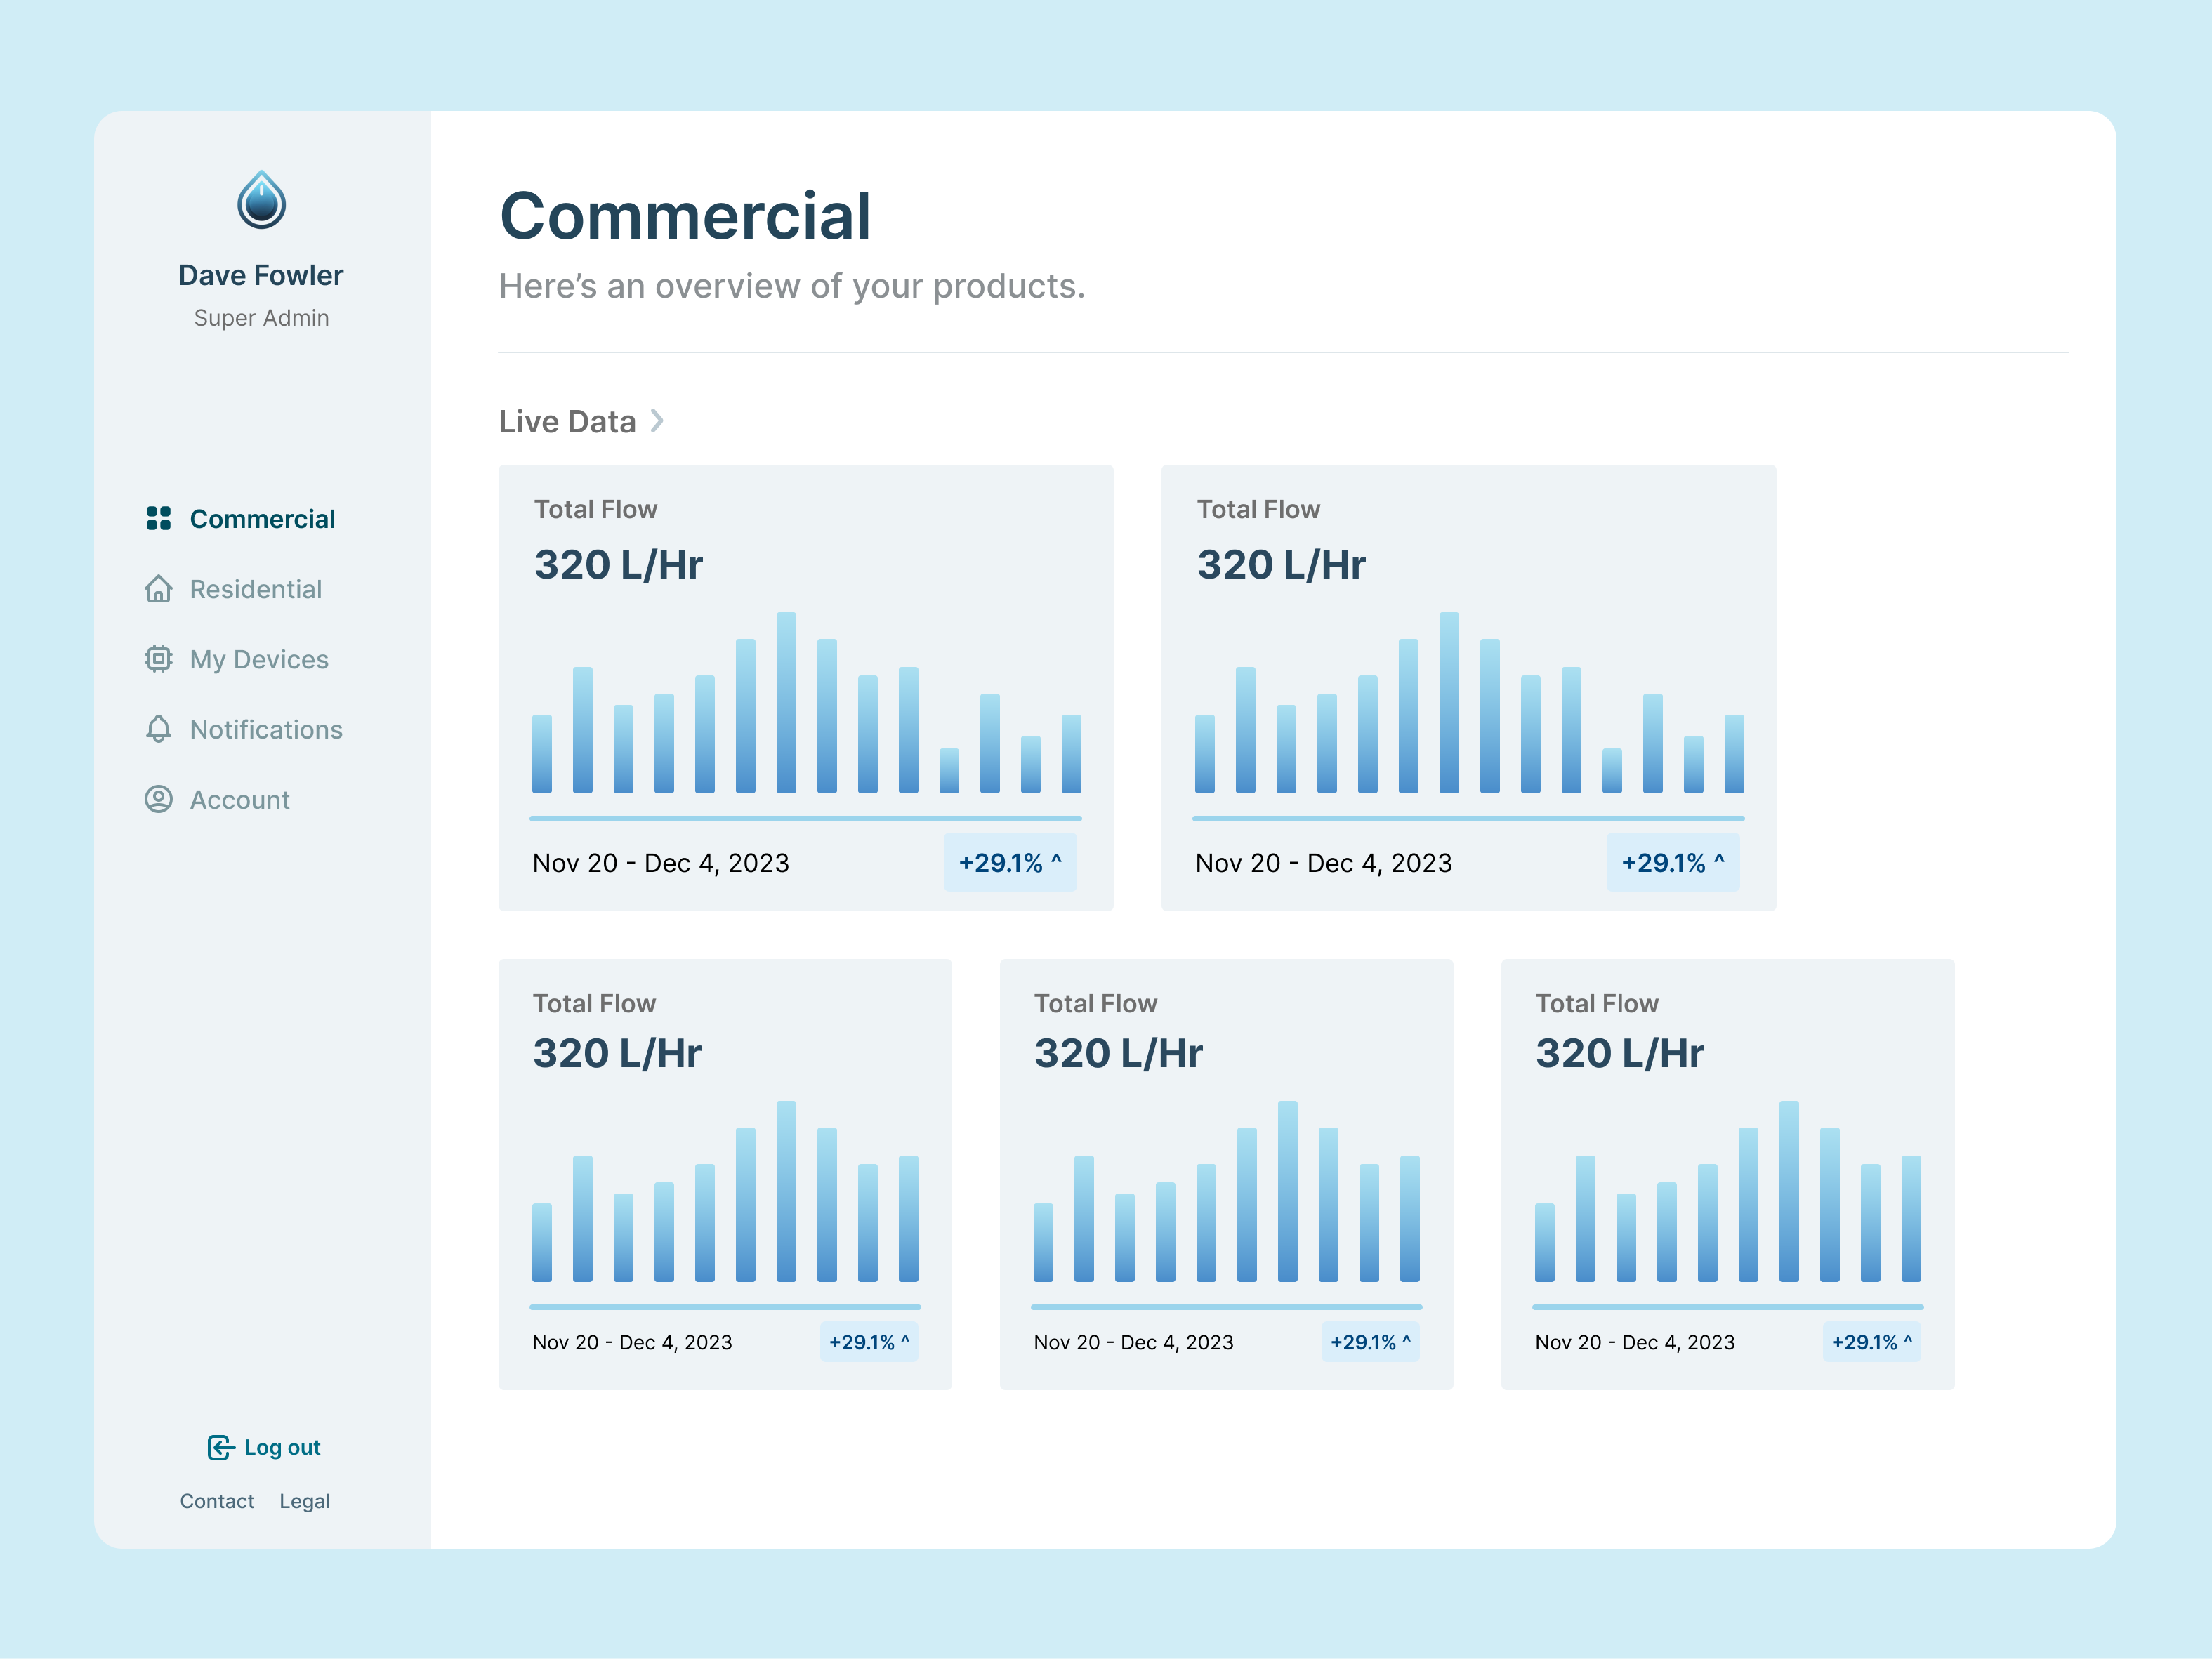
The commercial dashboard concept groups water-flow summaries into cards, with navigation for residential data, devices, and account settings.Open full-size image 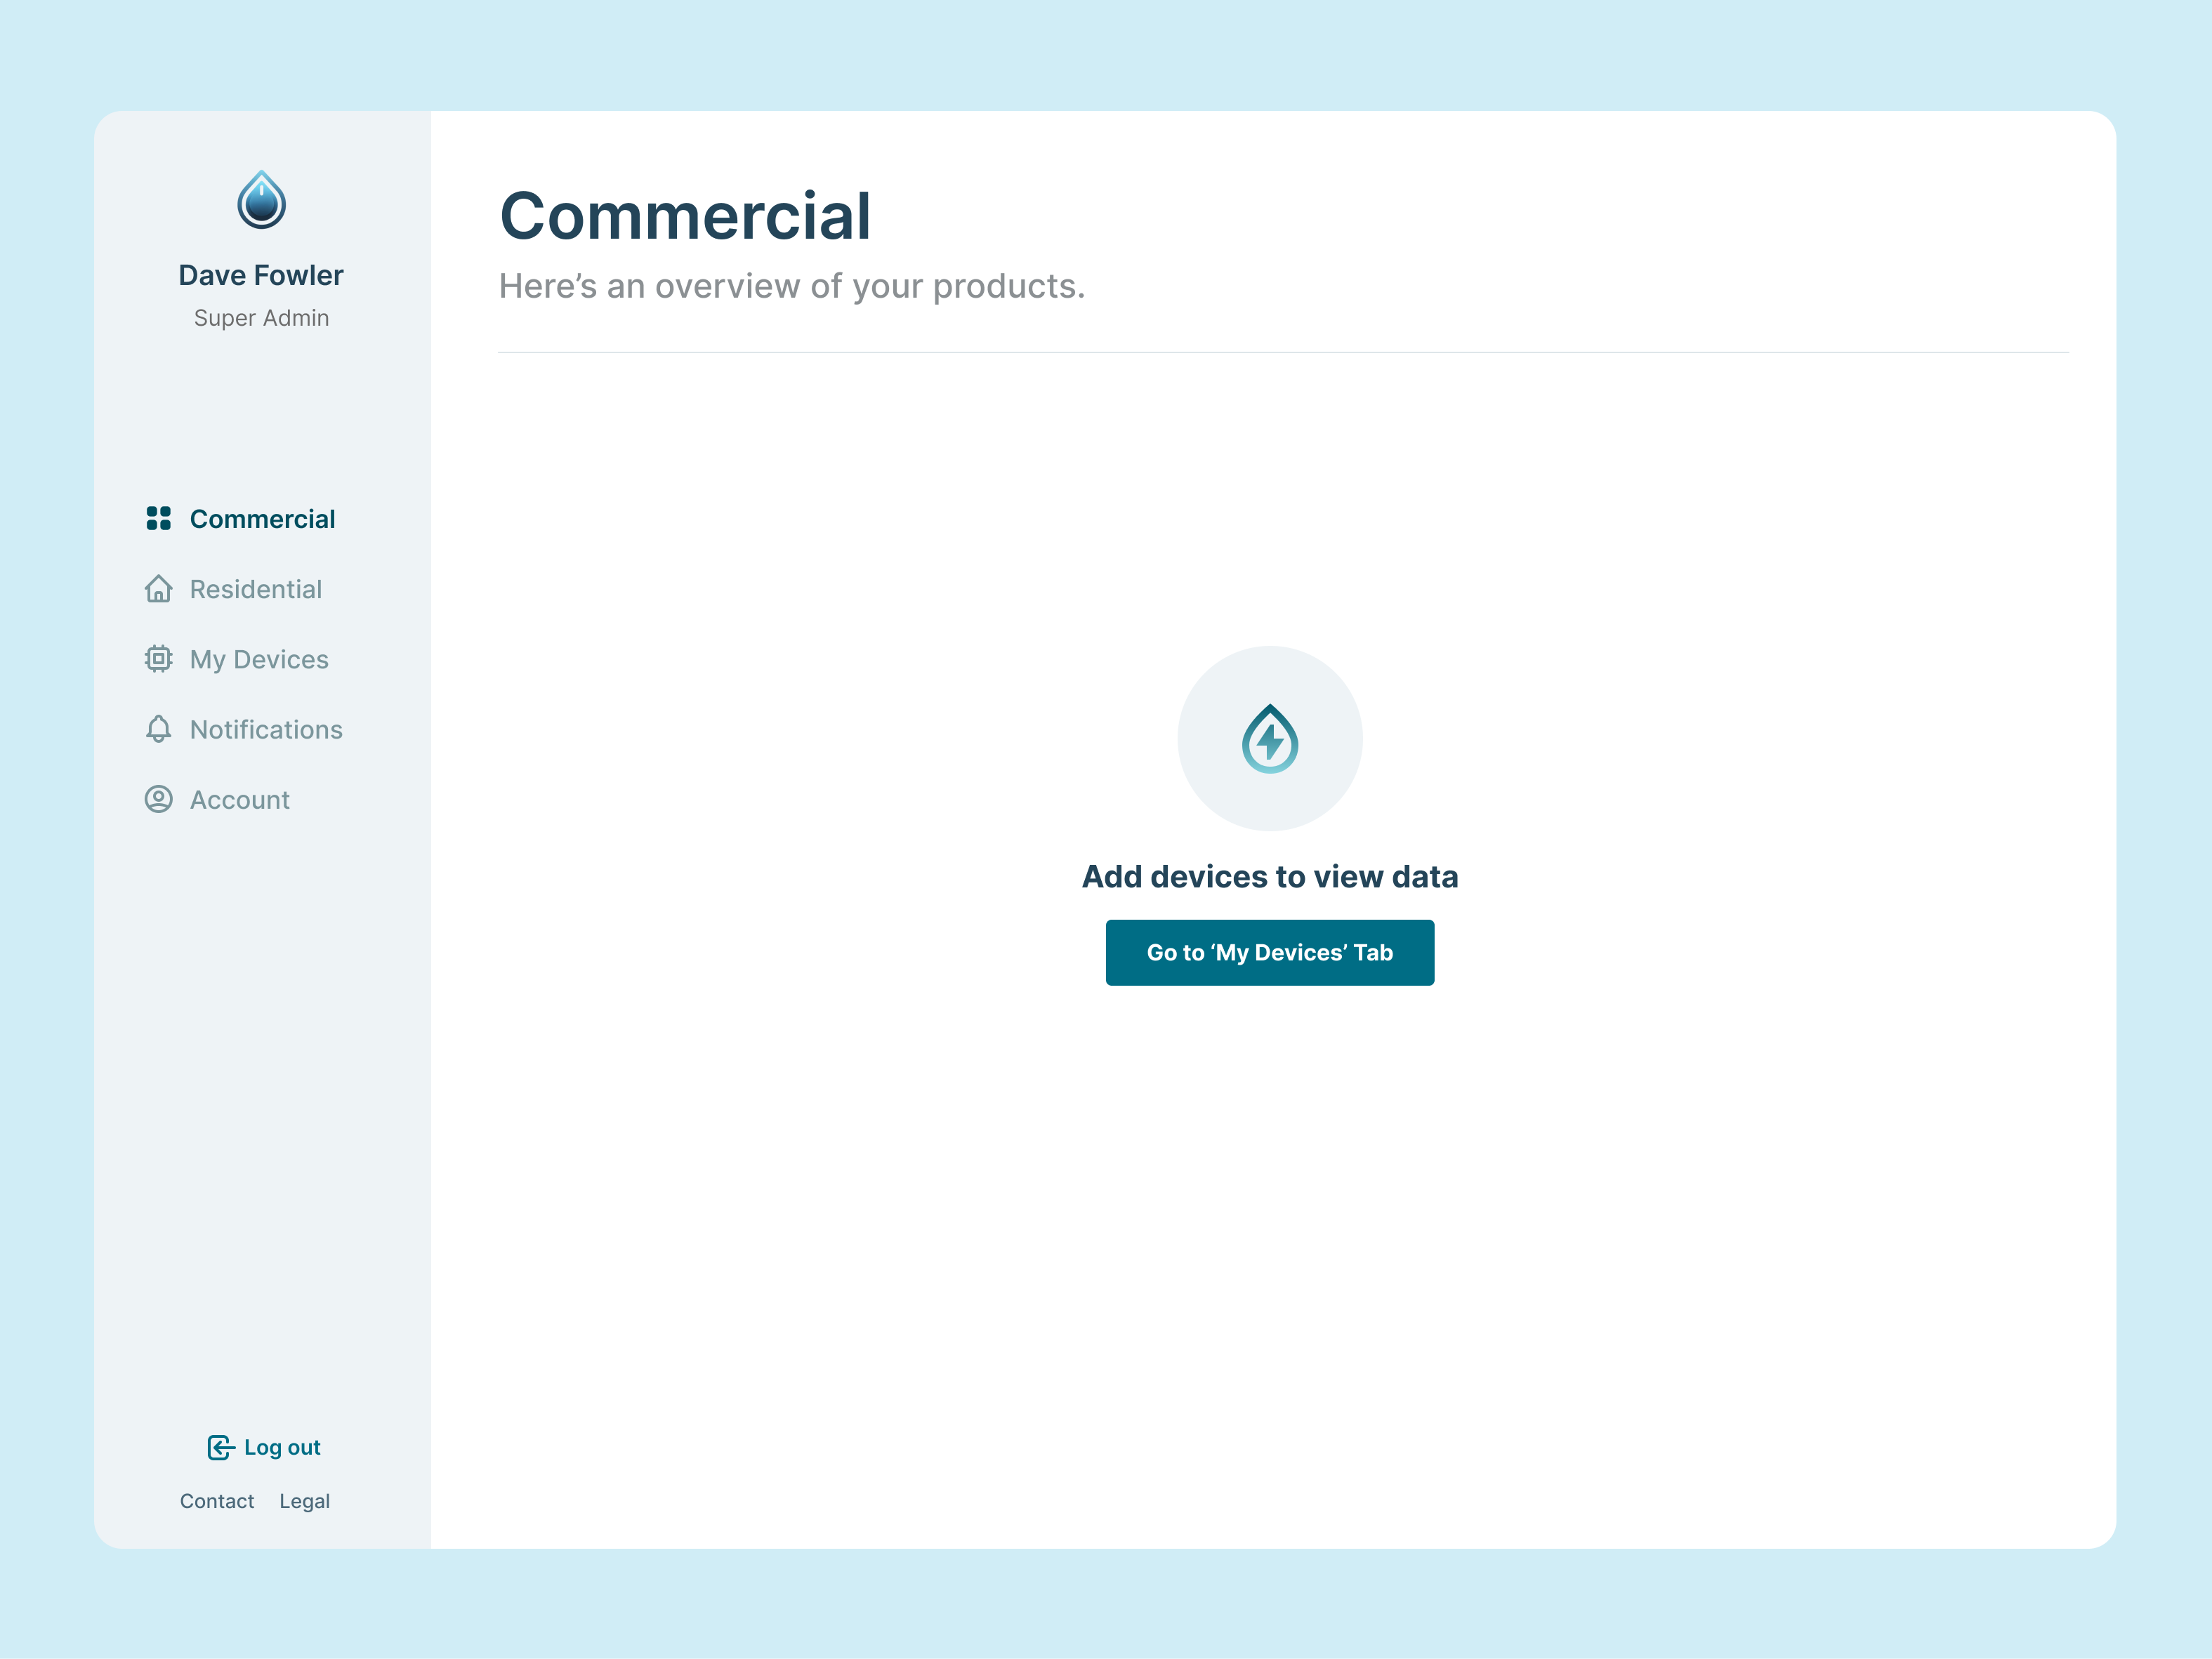
An empty dashboard state directs users to add a device before viewing water data.Open full-size image 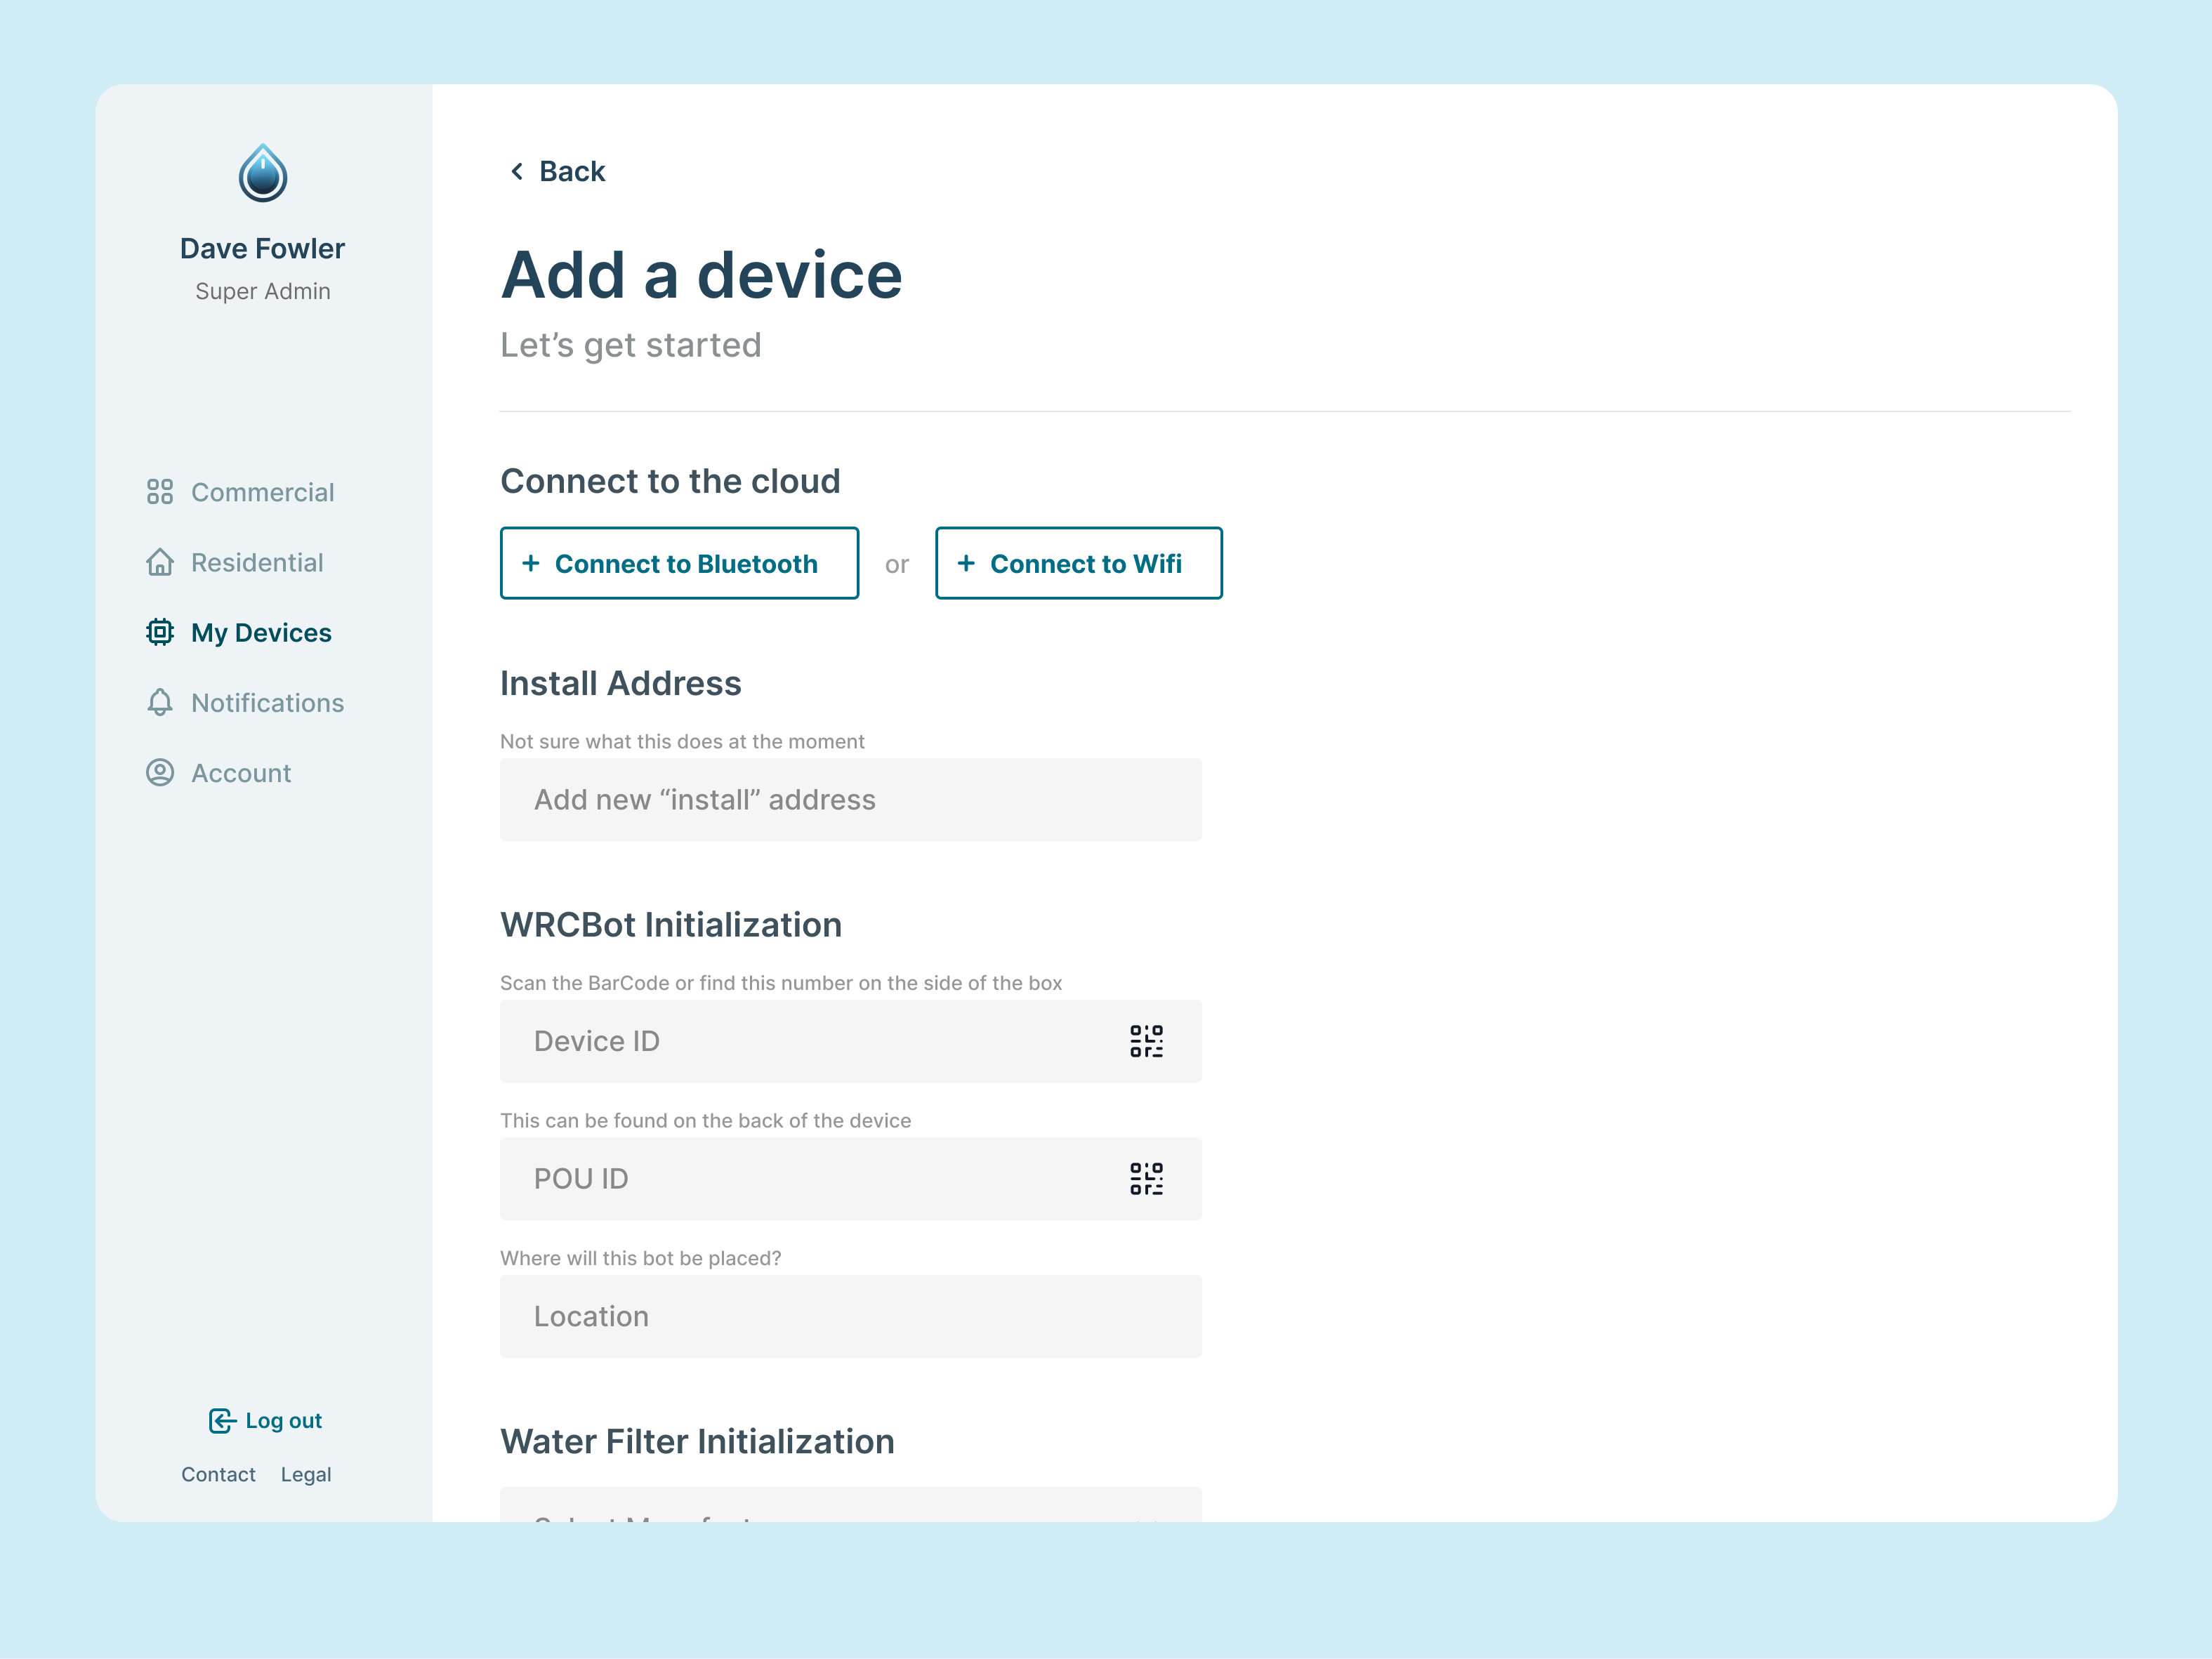
The device-setup concept covers Bluetooth or Wi-Fi connection, installation address, device identifiers, and location.Open full-size image 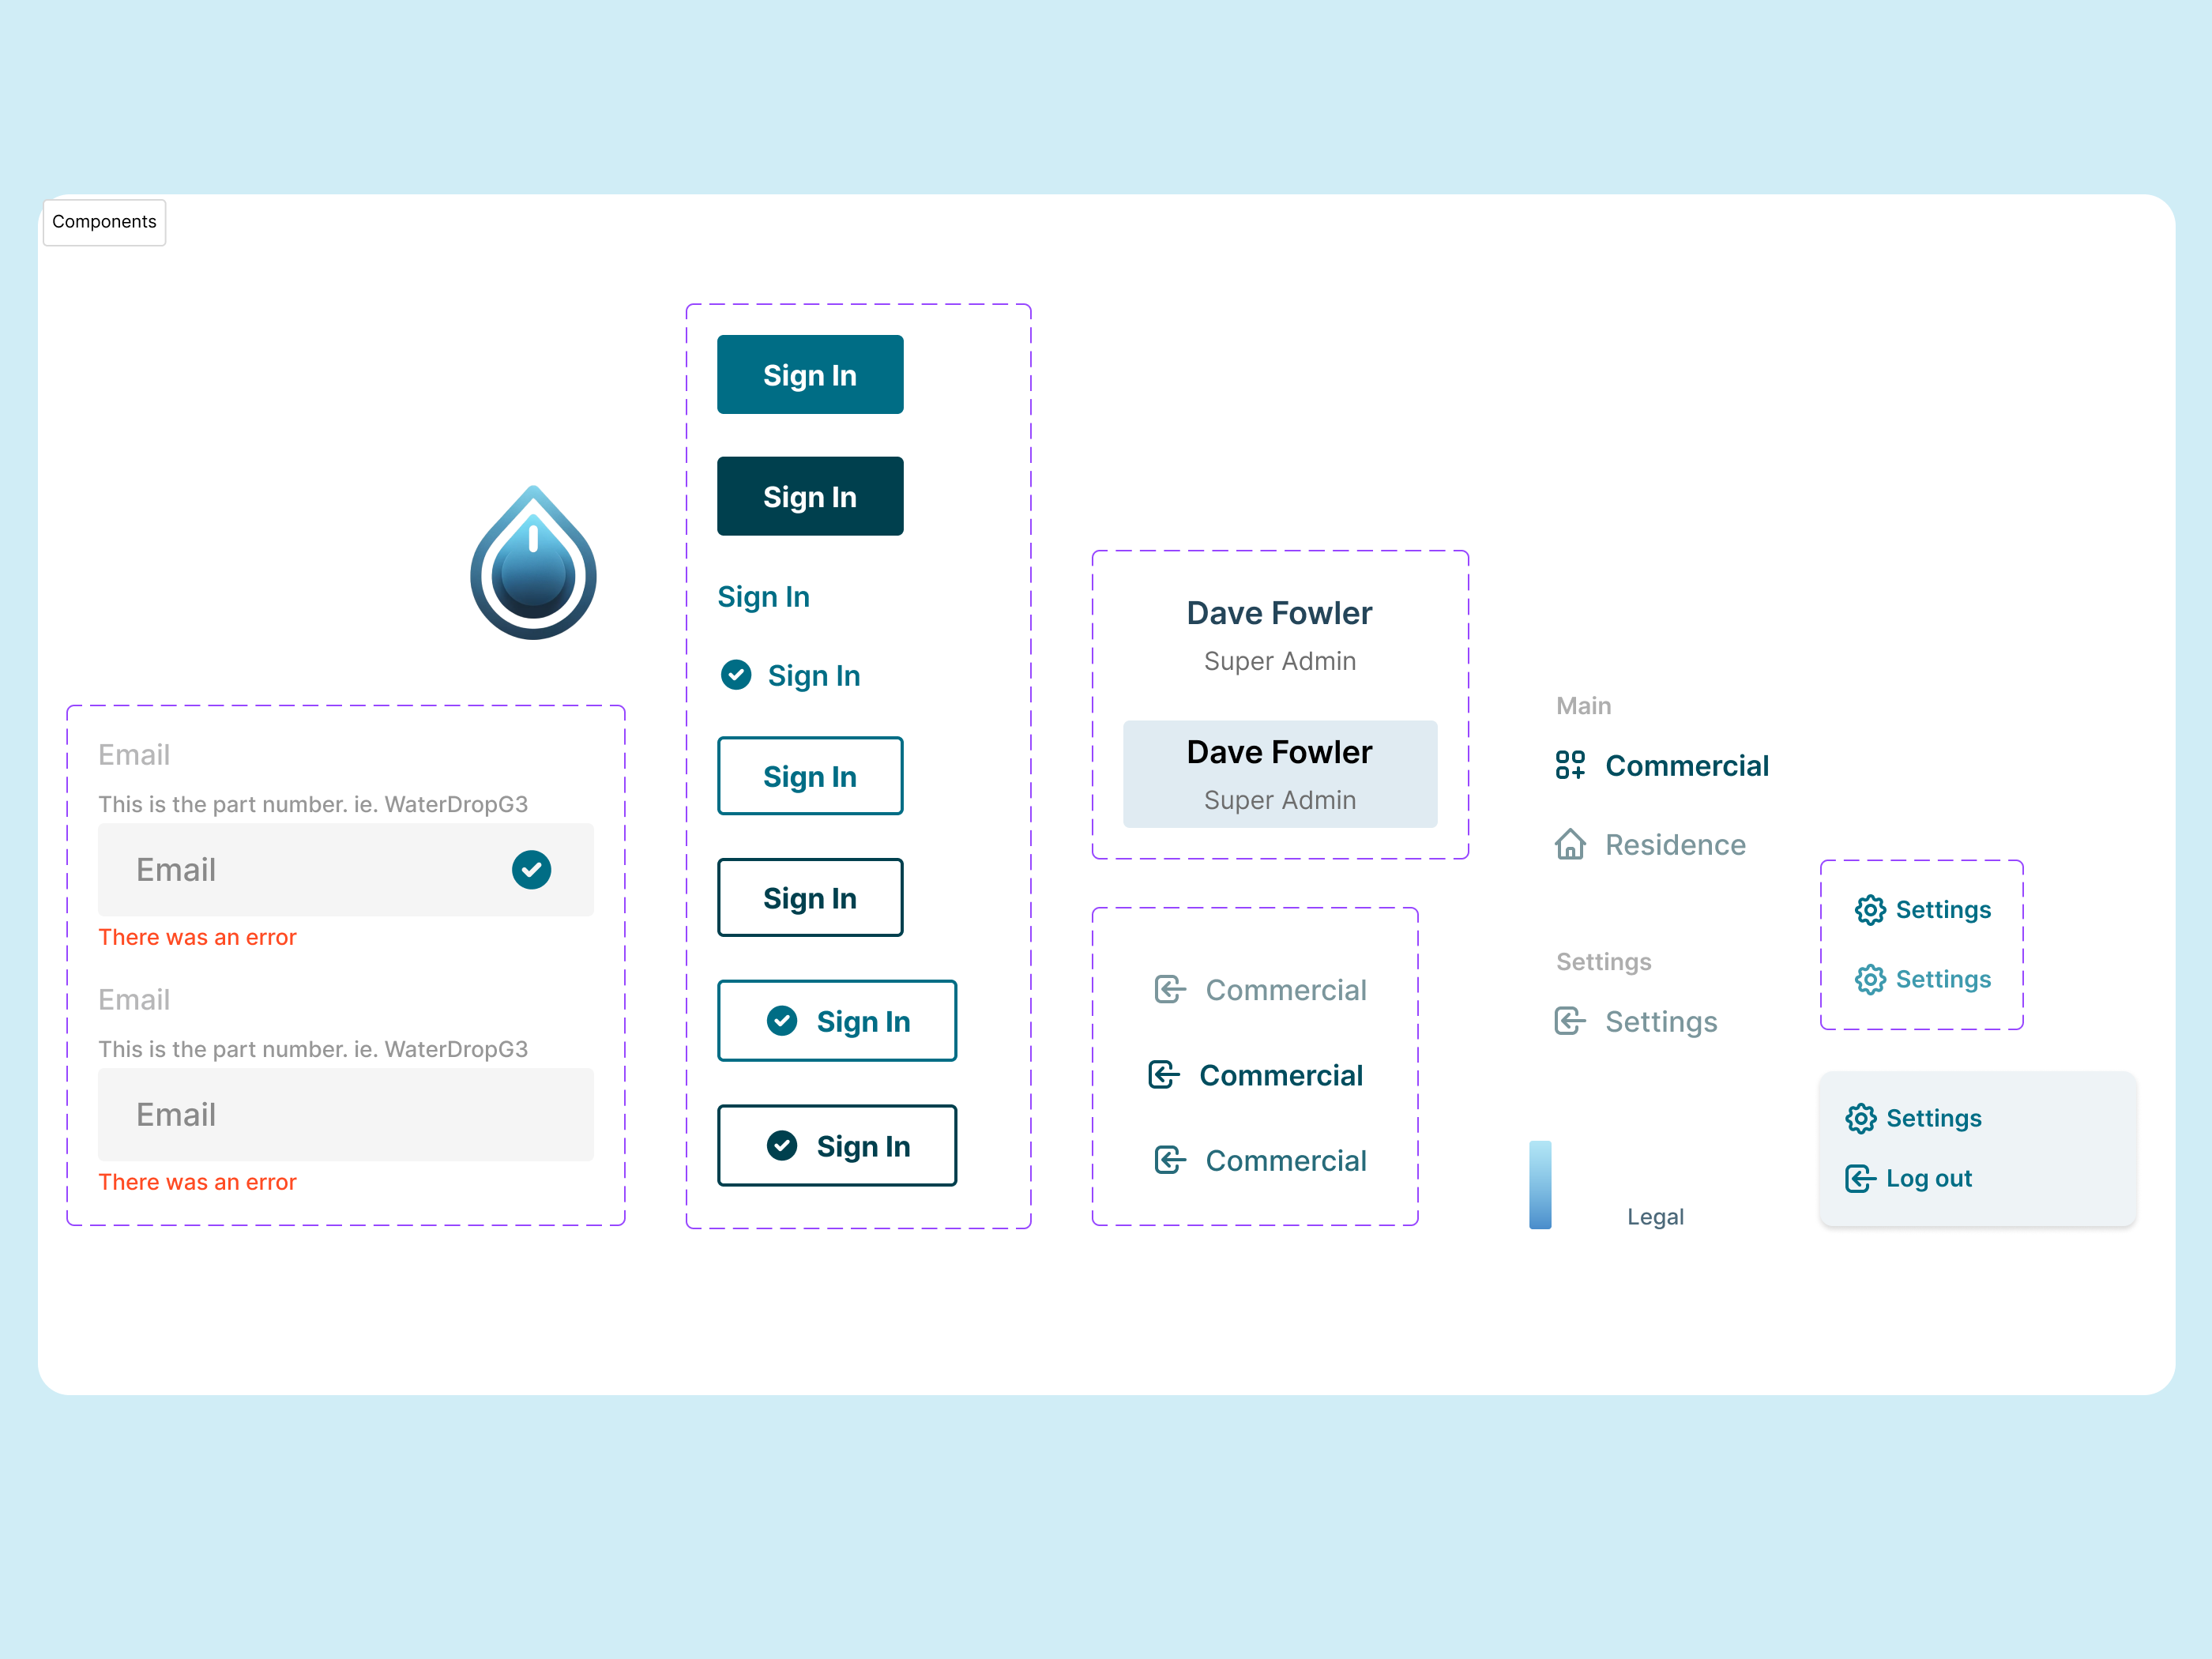
The interface component sheet defines input validation, button variants, account information, navigation, and settings states.Open full-size image


